Since I did not do as well on the quiz as I had hoped, I found some extra links to help me practice. Many of the mistakes were misunderstanding the concept or what the question was asking for, but some others I did not properly use the conversion factors we were supposed to memorize .
Here are some of the practice links I found:
http://www.chemteam.info/Electrons/calc-energy-freq-wavelength.html
https://www.khanacademy.org/science/chemistry/electronic-structure-of-atoms/electron-configurations-jay-sal/v/electron-configurations-2#!
http://terpconnect.umd.edu/~wbreslyn/chemistry/electron-configurations/electron_configuration_worksheet.html
Sunday, March 6, 2016

Monday, February 29, 2016
Flame Test Lab
The first experiment we did with this unit was the flame test. It wasn't very difficult, but instead it was much more fun to watch and observe. All we had to do was turn on the Bunsen burner and put the sticks from the sample cups in the flames and observe the colors produced. This went along with our lesson when we were talking about the wavelengths of different colors on the electromagnetic spectrum.
Here are some links to show how it worked:
https://www.bing.com/videos/search?q=flame+test&&view=detail&mid=24560B8CD7C7DE0537DE24560B8CD7C7DE0537DE&FORM=VRDGAR
https://www.bing.com/videos/search?q=flame+test&qpvt=flame+test&view=detail&mid=7ADBEC8E4F2CD7DC57F97ADBEC8E4F2CD7DC57F9&FORM=VRDGAR
Here is what one of our tests looked like:

Here is the general idea of what it would look like:
Here are some links to show how it worked:
https://www.bing.com/videos/search?q=flame+test&&view=detail&mid=24560B8CD7C7DE0537DE24560B8CD7C7DE0537DE&FORM=VRDGAR
https://www.bing.com/videos/search?q=flame+test&qpvt=flame+test&view=detail&mid=7ADBEC8E4F2CD7DC57F97ADBEC8E4F2CD7DC57F9&FORM=VRDGAR
Here is what one of our tests looked like:

 |
| capthttp://chemistry.com.pk/wp-content/uploads/2014/08/Metal-Ion-Flame-Test-Colours.jpgion |
Sunday, February 28, 2016
Electron configuration
In our second lesson, we started to learn about electron configuration. We started by coloring our periodic table into the four sections, s,p,d,f; with this one class came up with Smart People Dropped First Semester to remember the different blocks. These blocks are used to create the identity along with the numbers. Here is what it looks like:(
https://dr282zn36sxxg.cloudfront.net/datastreams/f-d%3A0d99818a52b825e7cf4e51d8c68a3b0746467d8e519cd5fb7b6f914e%2BIMAGE_THUMB_POSTCARD%2BIMAGE_THUMB_POSTCARD.1
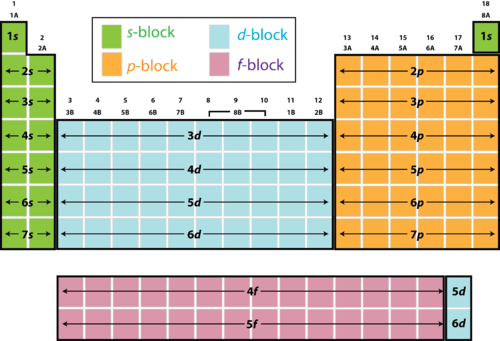
In the s block, there is 1 orbital, that can be filled with 2 electrons
The p block has 3 orbitals with 6 electrons
The d block has 5 orbitals with 10 electrons
The f block has 7 orbitals with 14 electrons
These are the maximum amounts of electrons that may fill up the orbitals that are present in each block. First they must go in with positive spin, and then fill in with negative spin once all the orbitals have filled up.
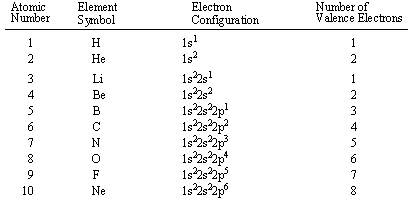
We then learned about shortcuts when naming the elements with their configurations. For this, you can only use the noble gases, and they must be the most previous gas before the element you are trying to name, and you also cannot use a noble gas as its own shortcut.
https://dr282zn36sxxg.cloudfront.net/datastreams/f-d%3A0d99818a52b825e7cf4e51d8c68a3b0746467d8e519cd5fb7b6f914e%2BIMAGE_THUMB_POSTCARD%2BIMAGE_THUMB_POSTCARD.1
In the s block, there is 1 orbital, that can be filled with 2 electrons
The p block has 3 orbitals with 6 electrons
The d block has 5 orbitals with 10 electrons
The f block has 7 orbitals with 14 electrons
These are the maximum amounts of electrons that may fill up the orbitals that are present in each block. First they must go in with positive spin, and then fill in with negative spin once all the orbitals have filled up.
 |
| http://img.sparknotes.com/figures/0/083ee1e849c82204c3d7c342d336a448/fig1_5.gif |
We then learned about shortcuts when naming the elements with their configurations. For this, you can only use the noble gases, and they must be the most previous gas before the element you are trying to name, and you also cannot use a noble gas as its own shortcut.
Beginning of Unit
Recently, we started a new unit concerning more directly of the periodic table and looking at trends and properties of elements and different ways to write them. The first lesson was on wavelengths, frequencies, and energy. First, we looked at what a wavelength looks like, and the different parts of it. Here is what that looks like:
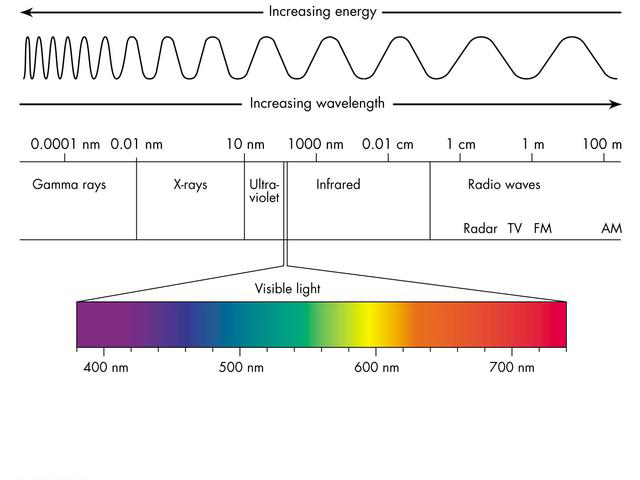
We then talked about the electromagnetic spectrum, and the electronic structure, which is the arrangement of electrons. We learned that visible light is a form of electromagnetic radiation, otherwise known as radiant energy, and the light that we see is connected with the wavelength of a number x 10^-7. An important thing to remember is that within visible light, violet has high energy and red has lower energy, and this corresponds with the frequency.
 |
| http://images.tutorvista.com/cms/images/83/wavelength-image.PNG |
A long wavelength=low frequency=low energy
A short wavelength=high frequency=high energy
 |
| http://www.cyberphysics.co.uk/topics/radioact/Radio/EMSpectrumcolor.jpg |
Here are some links to help practice and understand the concepts we covered:
http://www.chemteam.info/Electrons/calc-wavelength-given-freq.html
http://www.kentchemistry.com/links/AtomicStructure/waveequations.htm
http://www.chemteam.info/Electrons/calc-wavelength-given-freq.html
http://www.kentchemistry.com/links/AtomicStructure/waveequations.htm
Tuesday, February 9, 2016
Titration Lab
For the last few days, My lab partner and I have been running an experiment very similar to the one we did last week, percent acetic acid in vinegar, but this time we had to ultimately find the molar mass of an unknown acid. For this lab, we titrate an acid we are given to as I said before, find the molarity of it. First to start the lab, we had to standardize the base solution, so I weighed about 0.2g, added it to a Erlenmeyer flask by rinsing it with diluted water, added about 100mL of diluted water, added 2 drops of indicator, and finally titrated it until it turned pink. We did this twice and averaged the two for our calculations. When the solution turns pink, we know that all of the KHP had been reacted. Next, we did the same thing by titrating the unknown acid that we had to weigh. Finding the molarity in the first two and solving for just the moles of HA is what was then used for more calculations.
Here are some pictures from the lab:

 Also, Lauren broke an Erlenmeyer flask when we were cleaning up lab:

Here are some pictures from the lab:


Monday, February 8, 2016
Final Lecture
Our last lecture before two labs and a unit exam was over problems with acids and bases involving stoichiometry. With these types of problems we were asked to solve for a particular unknown, generally the pH, concentration, or volume. Most of the problems gave us enough information to directly answer the question, while others didn't. such as those which we had to find the limiting reagent with stoichiometry first. Also, all of the problems we did in class were a 1:1 molar ratio, which was nice to start off with, but also makes it more challenging when problems have different molar ratios. These problems generally are associated with acid-base titrations, so we learned also about the different materials and parts used when conducting a titration.
In addition to doing the stoichiometry we are already familiar with, we were also introduced to the formula MaVa=MbVb, but this only works for a 1:1 molar ratio, and thus it would need an additional step at the end to include that ratio.
Here is a link to practice these problems:
http://www.chemteam.info/AcidBase/titration-problems-2.html
And here is a quick walk through it:
http://chem.illinois.edu/CLCtutorials/102/WASB/SeeIt.html
We also slightly talked about Titration Curves within our lesson, which show the relationship between pH and the volume.
In addition to doing the stoichiometry we are already familiar with, we were also introduced to the formula MaVa=MbVb, but this only works for a 1:1 molar ratio, and thus it would need an additional step at the end to include that ratio.
Here is a link to practice these problems:
http://www.chemteam.info/AcidBase/titration-problems-2.html
And here is a quick walk through it:
http://chem.illinois.edu/CLCtutorials/102/WASB/SeeIt.html
We also slightly talked about Titration Curves within our lesson, which show the relationship between pH and the volume.
 |
| http://image.tutorvista.com/content/ionic-equilibrium/titration-curve-strong-acid-base.gif |
ICE Box Problems
One type of problem that was more detailed and difficult within the last lesson was problems called ICE box problems. These types of problems are designated solely for when you identify the acid or base is weak, but still want to find the pH of it. You cannot use the same system as you would for the strong acids and bases, but instead use this. To set up the problem you first write the letters ICE vertically along the left hand side. The I stands for initial, the C stands for change and the E stands for equilibrium, and the chemical equation is above the box, horizontally. Next to the I is always the molarity given to you in the problem, and going across will be two dashes, since no data will be shown there. Next, in the C column, you will place a -x. +x, +x, and finally in the E column you will add the two columns up. Then, this information will be put into the equation Ka= [H+][ClO-]/[HClO]. This will further turn into a quadratic equation when numbers are plugged in, and you must solve for x. An easy way to do this is to graph the quadratic and identify the zeros with a function on the calculator. The final step is to convert into pH with the equation pH=-log[H+].
Here is a picture and some links to visually understand and practice this concept:
http://www.chem.purdue.edu/gchelp/howtosolveit/Equilibrium/ICEchart.htm
https://www.youtube.com/watch?v=tT-2xk9ZG_A
Here is a picture and some links to visually understand and practice this concept:
http://www.chem.purdue.edu/gchelp/howtosolveit/Equilibrium/ICEchart.htm
https://www.youtube.com/watch?v=tT-2xk9ZG_A
 |
| capthttp://i.ytimg.com/vi/3HvZxGhuiSE/0.jpg |
Subscribe to:
Posts (Atom)