Earlier this week we did a lab in class in which we tested the reactivity of several metals in different aqueous solutions. The lab was much more interesting to me than the others, because we could actually see the reactions happening through gas production, color changing and bubbling. We had to complete a chart on what we saw react and what we observed happening. From what we put down in our chart, we made our own reactivity series and this really helped me understand this concept. Here is a picture of one of the reactions that lasted longer, changed colors, and bubbled also:
Here's a link further explaining the reactivity series:
http://www.cod.edu/people/faculty/jarman/richenda/1551_hons_materials/Activity%20series.htm
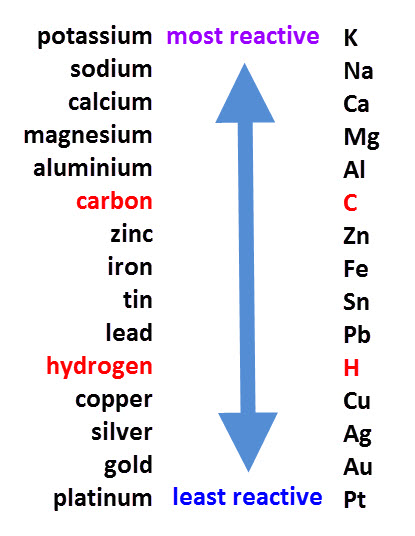
Now, this is what the standard reactivity series looks like. Those on top of the list are more reactive, and those toward the bottom are less. You use these comparisons in single replacement reactions.

No comments:
Post a Comment